


Akamai’s Latest Report Shows United States Progress
The latest edition of Akamai’s State of the Internet report has just been released, covering the 3rd Quarter of 2013. The previous quarter had shown a slight dip in the speed rankings for the US relative to the rest of the world, but the new data show a reversal of that trend: The US is rising again. The most interesting look at the overall situation is at the end of this post, to force you to read the whole thing. If you’re impatient, skip the third graph.
Akamai measures wired network performance three ways, all of them useful but subtly different. Their best measure of raw network capacity is their “Average Peak Connection Speed,” which collects the highest speed measured on each IP address they see (close to a billion around the world.) The U. S. rose from 16th place in the 2nd Quarter of 2013 to 13th place in the 3rd Quarter. Our highest ranking ever in this category was 7th place in the 3rd Quarter of 2010, just before the FCC’s Open Internet Order was passed. I’m sure it’s coincidental that America’s wired networks declined in the global rankings while the OIO was in effect. The next few quarters will tell the tale. The current average capacity of America’s broadband networks is now 37 Mbits/sec, enough to get some serious work done as long as the connection isn’t too heavily shared.
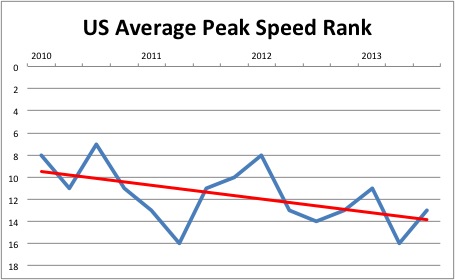
America’s Average Network Capacity Ranking
The most widely circulated figure is Akamai’s Average Connection Speed ranking, but it’s also the most misunderstood measurement. Many writers – such as Cyrus Farivar at Ars Technica – mistakenly claim that ACS represents typical network speeds:
Ars contacted Chris Nicholson, a spokesperson at Akamai, who agreed with us that the “average connection speed,” of 7.2Mbps represents the actual, real-world average. As any Internet user can attest, real-world speeds fluctuate quite a bit, and an “average peak connection speed” is hardly the same as “average connection speed.”
This is a misunderstanding of the conversation, as I’ve verified in my own conversations with Akamai. ACS is measured at the TCP level, as is Average Peak Connection Speed (APCS), but it’s affected by three factors that are relatively absent from APCS:
- The effects of connection sharing at a home router or business firewall
- The effects of parallel browser streams, which are typically 4 to 8.
- The effects of transient network congestion
Most of the Akamai measurements are taken while people are browsing the web, so they represent all three factors, but the peak speeds are going to be found when these factors are not deeply present. Some have argued that transient congestion accounts for most of the difference between ACS and APCS, but I’m pretty certain that factor 2, browser parallelism, is the most common culprit. When you load a web page, your browser downloads 4 to 8 page elements – pictures and blocks of text – at the same time, to the speed of each of those parallel downloads can’t be any faster than the raw network rate, APCS, divided by the number of parallel downloads. So if the APCS is 40, the ACS will be closer to 10 if there’s no router sharing and no network congestion. So what do we see?
The US ranks higher in Average Connection Speed than we do in APCS: We’ve at 8th place in the world for the second consecutive quarter, up from 9th in Q1 of 2013, and our ACS is 9.8 Megabits/second, which is pretty close to 10.
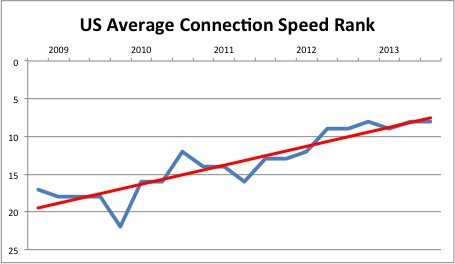
America’s Average TCP Connection Speed Ranking
As you can see, the trend line is going up sharply for this metric, even though the the trend line for raw capacity is going down gently. This suggests that there’s more variability and more sharing in other nations’ networks. There is some data and much anecdotal evidence to the effect that middle mile and core network capacity is not as high in many countries as it is in the US, relative to last mile capacity. Recent articles on Comcast’s terabit network links underscore this trend.
The most interesting overall figure is Akamai’s “High Broadband (>10 Mbps) Connectivity” index. This uses the ACS measurement to distinguish the portion of the population that typically connects at the highest speeds – more than 10 Megabits/second – from the rest. This is the oldest measurement that Akamai reports, and it shows how well prepared each nation is to use the Internet applications that require the most bandwidth.
This is more meaningful that simply measuring raw speeds, because any network that can deliver more than 20 Mbps/user has more than enough capacity to allow us to run all the applications the Internet has to offer (or is likely to offer anytime soon.) On this index, we’re now in a tie with Latvia and Belgium for 7th place.
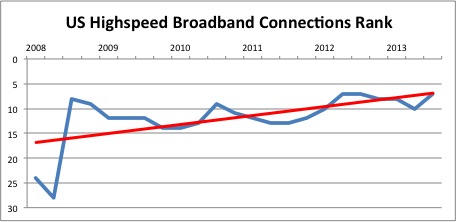
America’s High Broadband Connectivity Ranking
What’s interesting about this ranking is how our population and land mass stand relative to the six nations that rank higher than we do. Akamai tells us what percentage of IP addresses in each country have >10 Mbps connection speeds:
| Nation | Percent |
| S. Korea | 70 |
| Japan | 49 |
| Netherlands | 44 |
| Switzerland | 39 |
| Hong Kong | 38 |
| Czech | 35 |
| Latvia | 34 |
| Belgium | 34 |
| US | 34 |
Akamai doesn’t know how many people access the Internet in each country, so we can’t precisely determine how many high-speed users there are. For purposes of comparison, we can get a pretty fair handle by dividing total population by the percentage of high speed users, since Internet adoption rates are quite similar in these nations. This arithmetic says there are no more than 114 million high speed users in the top six nations, and no more than 105 million in the US, so the gap can’t be very wide between the US and the Kings of High Broadband Connectivity. Only two of the top 6, Korea and Netherlands, are adding high speed users faster than we are. Our addition of 40% more in this category in one quarter is amazing in light of the work we have to do to upgrade our networks. While we have 92% as many high speed users as the total of the nations ahead of us, the land mass that we have to cover to reach them is 15 times greater than the combined land mass of the Speedy Six.
That’s right: for every mile of cable that connects high speed users in the Speedy Six, there are 14 miles of cable connecting high speed users in the U. S. We have 3.5 million square miles of land area compared to 238 thousand for the Six.
The lifestyle choices represented by the dense population in the highest speed broadband nations compared to the sparse population in the US explains a lot about how the numbers work on the pricing side.
Overall, we’re doing fine in the US.
[…] premise is wrong, as well as the closely related premise that American broadband quality sucks. The previous post in the latest Akamai data shows just how wrong these claims of American broadband suckitude really are. There’s no […]